 Gero Gerke
- Published on
Rendering OpenStreetMap vector streets using WebGL
Introduction
This is the first blog post of a series, where we're going to implement a (sidenote:
Although the screenshots used in this article do not contain an Attribution to OpenStreetMaps, all data used here is © OpenStreetMap contributors
) vector renderer using WebGL. This article assumes you have some familiarity with graphics programming and OpenGL / WebGL.
In the next articles, we will dive into some topics such as map projections, triangulation and optimizing the code to run as smoothly as possible.
How OSM works - the data format
To render just some streets, let's start simple. For now, two concepts of OSM are important to us: Nodes and Ways. Nodes are a single point (consisting of a longitude and latitude) which may have additional info about the point; and Ways which are lists of nodes.
To get our hands dirty with some OSM data, we can use the excellent Overpass Turbo to export some data from OSM into JSON for ease of use. Overpass Turbo is a tool that allows querying of OSM data in the browser and is typically used to find instances of wrongful applied tags or other problems within the OSM data. We can use it to generate a JSON file containing all ways and nodes in the viewport using the following query.
[out:json][timeout:25];
(
  node({{bbox}});
  way({{bbox}});
);
out body;
>;
out skel qt;
Make sure to center your viewport on a small section of the map such as a single city block as the query will return a lot of data. We can then press the "Export" button at the top and download the data as "raw OSM data". The downloaded JSON file will be the base for our renderer.
If we take a look at the file, there will be an array of ways and nodes which might look like the following:
{
    "type": "node",
    "id": 4343553726,
    "lat": 50.9184323,
    "lon": 6.3683069,
    "tags": {
        "amenity": "waste_basket"
    }
}
This particular node has a tag (also called property) that defines that this point is a Waste Bucket. Not all points must have tags, however. A way can look like this:
{
    "type": "way",
    "id": 8084052,
    "nodes": [
        60570837,
        60570839,
        60570845,
        922255974,
        60027691
    ],
    "tags": {
        "highway": "service",
        "service": "parking_aisle",
        "surface": "asphalt"
    }
}
This way consists of five nodes (whose locations we can look up from our JSON file) and is a Parking Aisle Street.
With this file, we're equipped to render streets using WebGL.
Line rendering in theory
Line rendering traditionally works by telling the GPU a list of points to draw a line between. OpenGL offers the GL_LINES and GL_LINE_STRIP primitives to render lines. However, these built-in methods are quite limited, only allowing a line-width up to 10 in some devices and offering no line-joins and line-caps. For now, this doesn't matter too much, but as we're improving the renderer these will be crucial. There are some alternatives to how we can render our streets, for example by triangulating the line our nodes form, or by rendering the lines ourselves using custom line rendering techniques. This is precisely what we're going to do, because it's quite performant and easy to understand and implement.
However, for our purpose, the built-in line-rendering of WebGL is not sufficient. It does not support arbitrary line-widths and no line joins. The internet is full of great resources about line rendering. For this example, we're going to base our line rendering on the method from Rye Terell.
Essentially, we draw a quad (consisting of two triangles) for each pair of nodes that a way consists of. These quads get stretched in the vertex shader to the desired length and way width. In the example above, our way consists of the points , we draw quads between to the way. In the future, we can optimize this more and render ALL ways at once.
Lastly, you might've noticed that there are some "holes" in the street when we just render quads. To fix this, we can later fill these holes using line joins to create a smooth road.
Rendering some streets using WebGL
We're going to use the REGL library to abstract some of cumbersome raw WebGL glue away, but allow us to implement the rendering ourselves. To render a way, we need the following attributes: position, a buffer of vec2 containing our two triangles that form the way quad; pointA and pointB both buffers of vec2 that contain the point being drawn from and the point being drawn to. Additionally, we need the following uniforms: wayWidth, a float the width of the way; wayColor, a vec3 containing the color we want to draw the way in and projection and view, both mat4 containing a (sidenote: In this part, we do not use any map projections yet. Instead, we multiply each rendered coordinate with a fixed scalar and translate the view by the center coordinates times the same scalar.) and the "eye" position where we're looking at on our map.
The shaders look as follows:
precision highp float;

attribute vec2 position;
attribute vec2 pointA, pointB;

uniform float wayWidth;
uniform mat4 projection;
uniform mat4 view;

void main() {
    vec2 xBasis = pointB - pointA;
    vec2 yBasis = normalize(vec2(-xBasis.y, xBasis.x));
    vec2 point = pointA + xBasis * position.x + yBasis * wayWidth * position.y;
    gl_Position = projection * view * vec4(point.xy, 0, 1);
}
In the vertex shader, we project the geometry and stretch it to cover both points and apply the correct way width passed as a uniform.
Finally, to render each way, we loop
precision highp float;

uniform vec3 wayColor;

void main() {
    gl_FragColor = vec4(wayColor.xyz, 1);
}
In the fragment shader, we color each pixel according to the way color we passed in.
To set up the rendering, we need a couple of things:
const SCALE_FACTOR = 200000
const CENTER_LAT = 50.78153 * SCALE_FACTOR
const CENTER_LON = 6.08226 * SCALE_FACTOR

const ways = json.elements.filter((el) => el.type === 'way')
const nodes = json.elements.filter((el) => el.type === 'node')

const wayCoords = ways
  .filter((way) => way.tags.highway !== undefined)
  .map((way) => ({
    ...way,
    node_locations: way.nodes
      .map((node_id) => nodes.find((node) => node.id === node_id))
      .map((node) => [node.lon * SCALE_FACTOR, node.lat * SCALE_FACTOR]),
  }))

const projection = mat4.ortho(mat4.create(), 0, canvas.width, 0, canvas.height, 1, -1)

const view = mat4.lookAt(
  mat4.create(),
  [CENTER_LON - canvas.width / 2, CENTER_LAT - canvas.height / 2, 1],
  [CENTER_LON - canvas.width / 2, CENTER_LAT - canvas.height / 2, 0],
  [0, 1, 0]
)
First, we parse the export from Overpass Turbo into two arrays. One contains all ways, one contains all nodes. Next, we must resolve the node references (Overpass Turbo generates a list of node IDs, we need the node lat/lon) to the locations. In this step, we apply a basic "transformation" which zooms into the map. You will see, as this is not a proper map transformation yet, that the closer your center coordinates go to the poles, the more distorted your map will look. To place our center coordinates actually at the center of the screen, we must subtract half-screen width and height from our view translation.
wayCoords.forEach((way) => {
  const buffer = regl.buffer(way.node_locations)
  buffer({
    data: way.node_locations,
  })
  renderWays({
    points: buffer,
    projection,
    view,
    viewport: { x: 0, y: 0, width: canvas.width, height: canvas.height },
    pointData: way.node_locations,
    color: wayColor(way),
    width: wayWidth(way),
    instances: way.node_locations.length - 1,
  })
})
Finally, we can render each way by updating the buffer data and rendering the way using the attributes and transforms provided. The wayColor and wayWidth methods map each OSM tag to a specific color and line width.
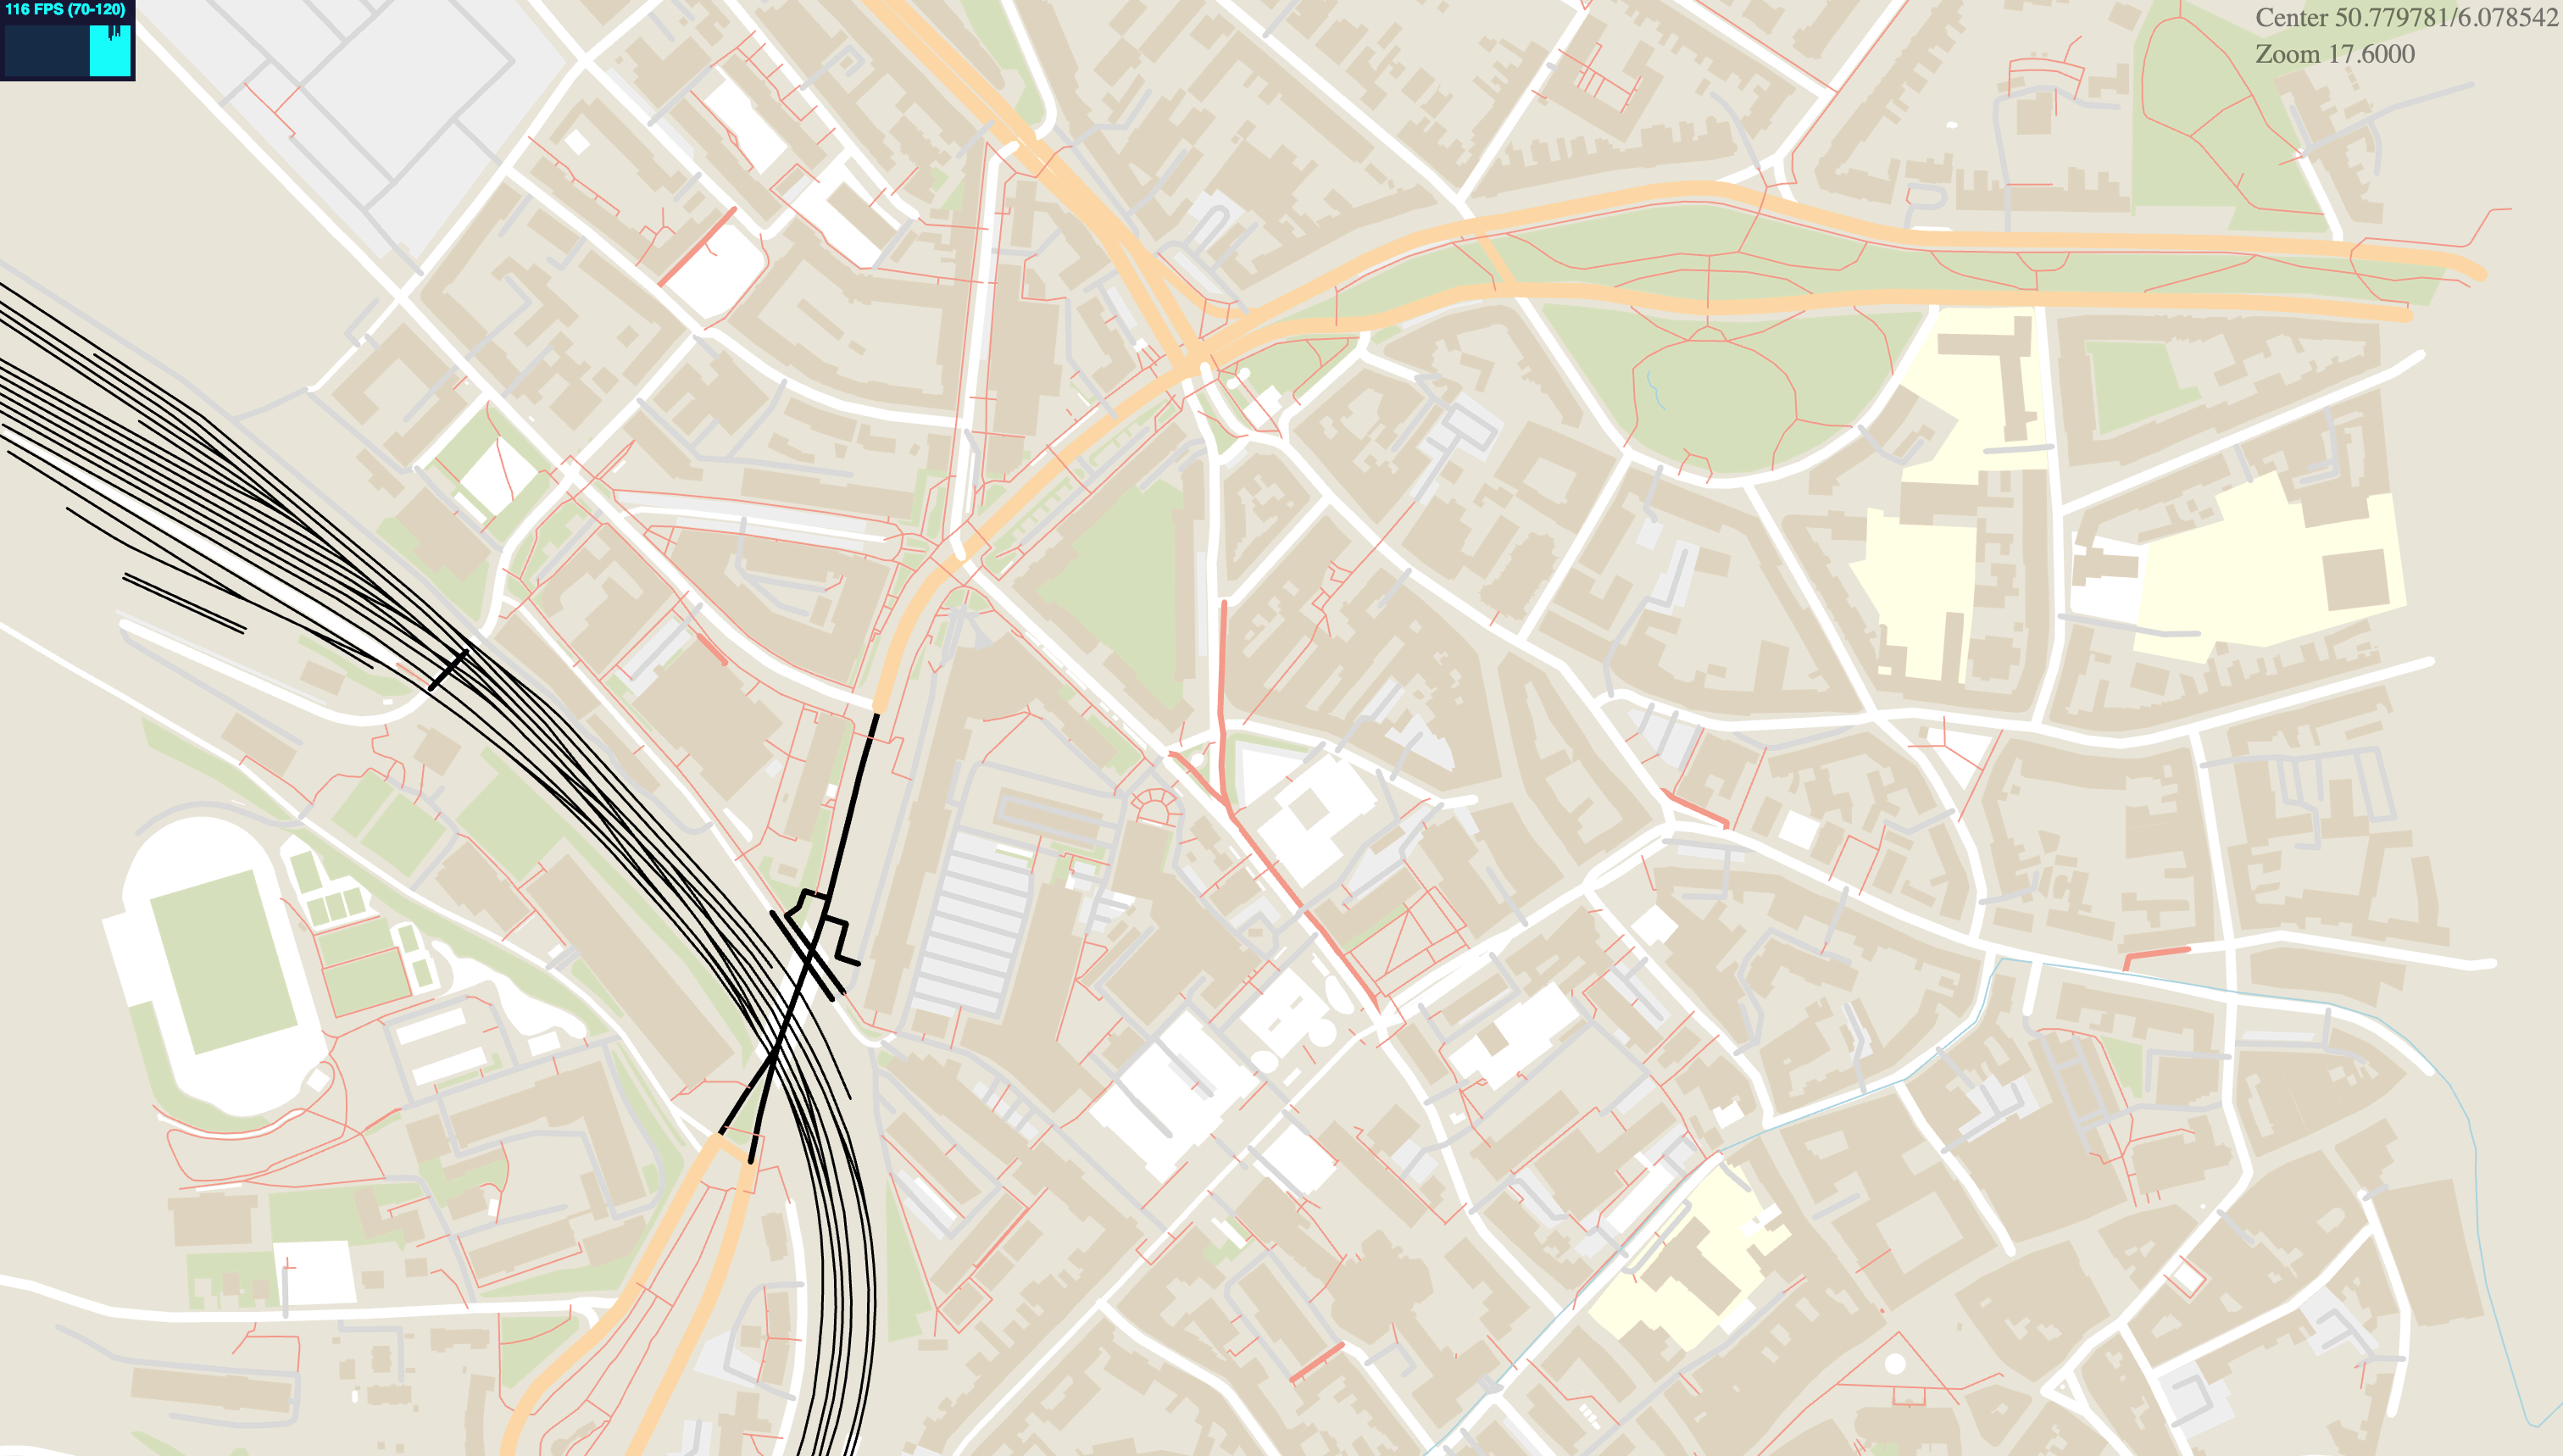
The ways we're rendering should look like this:
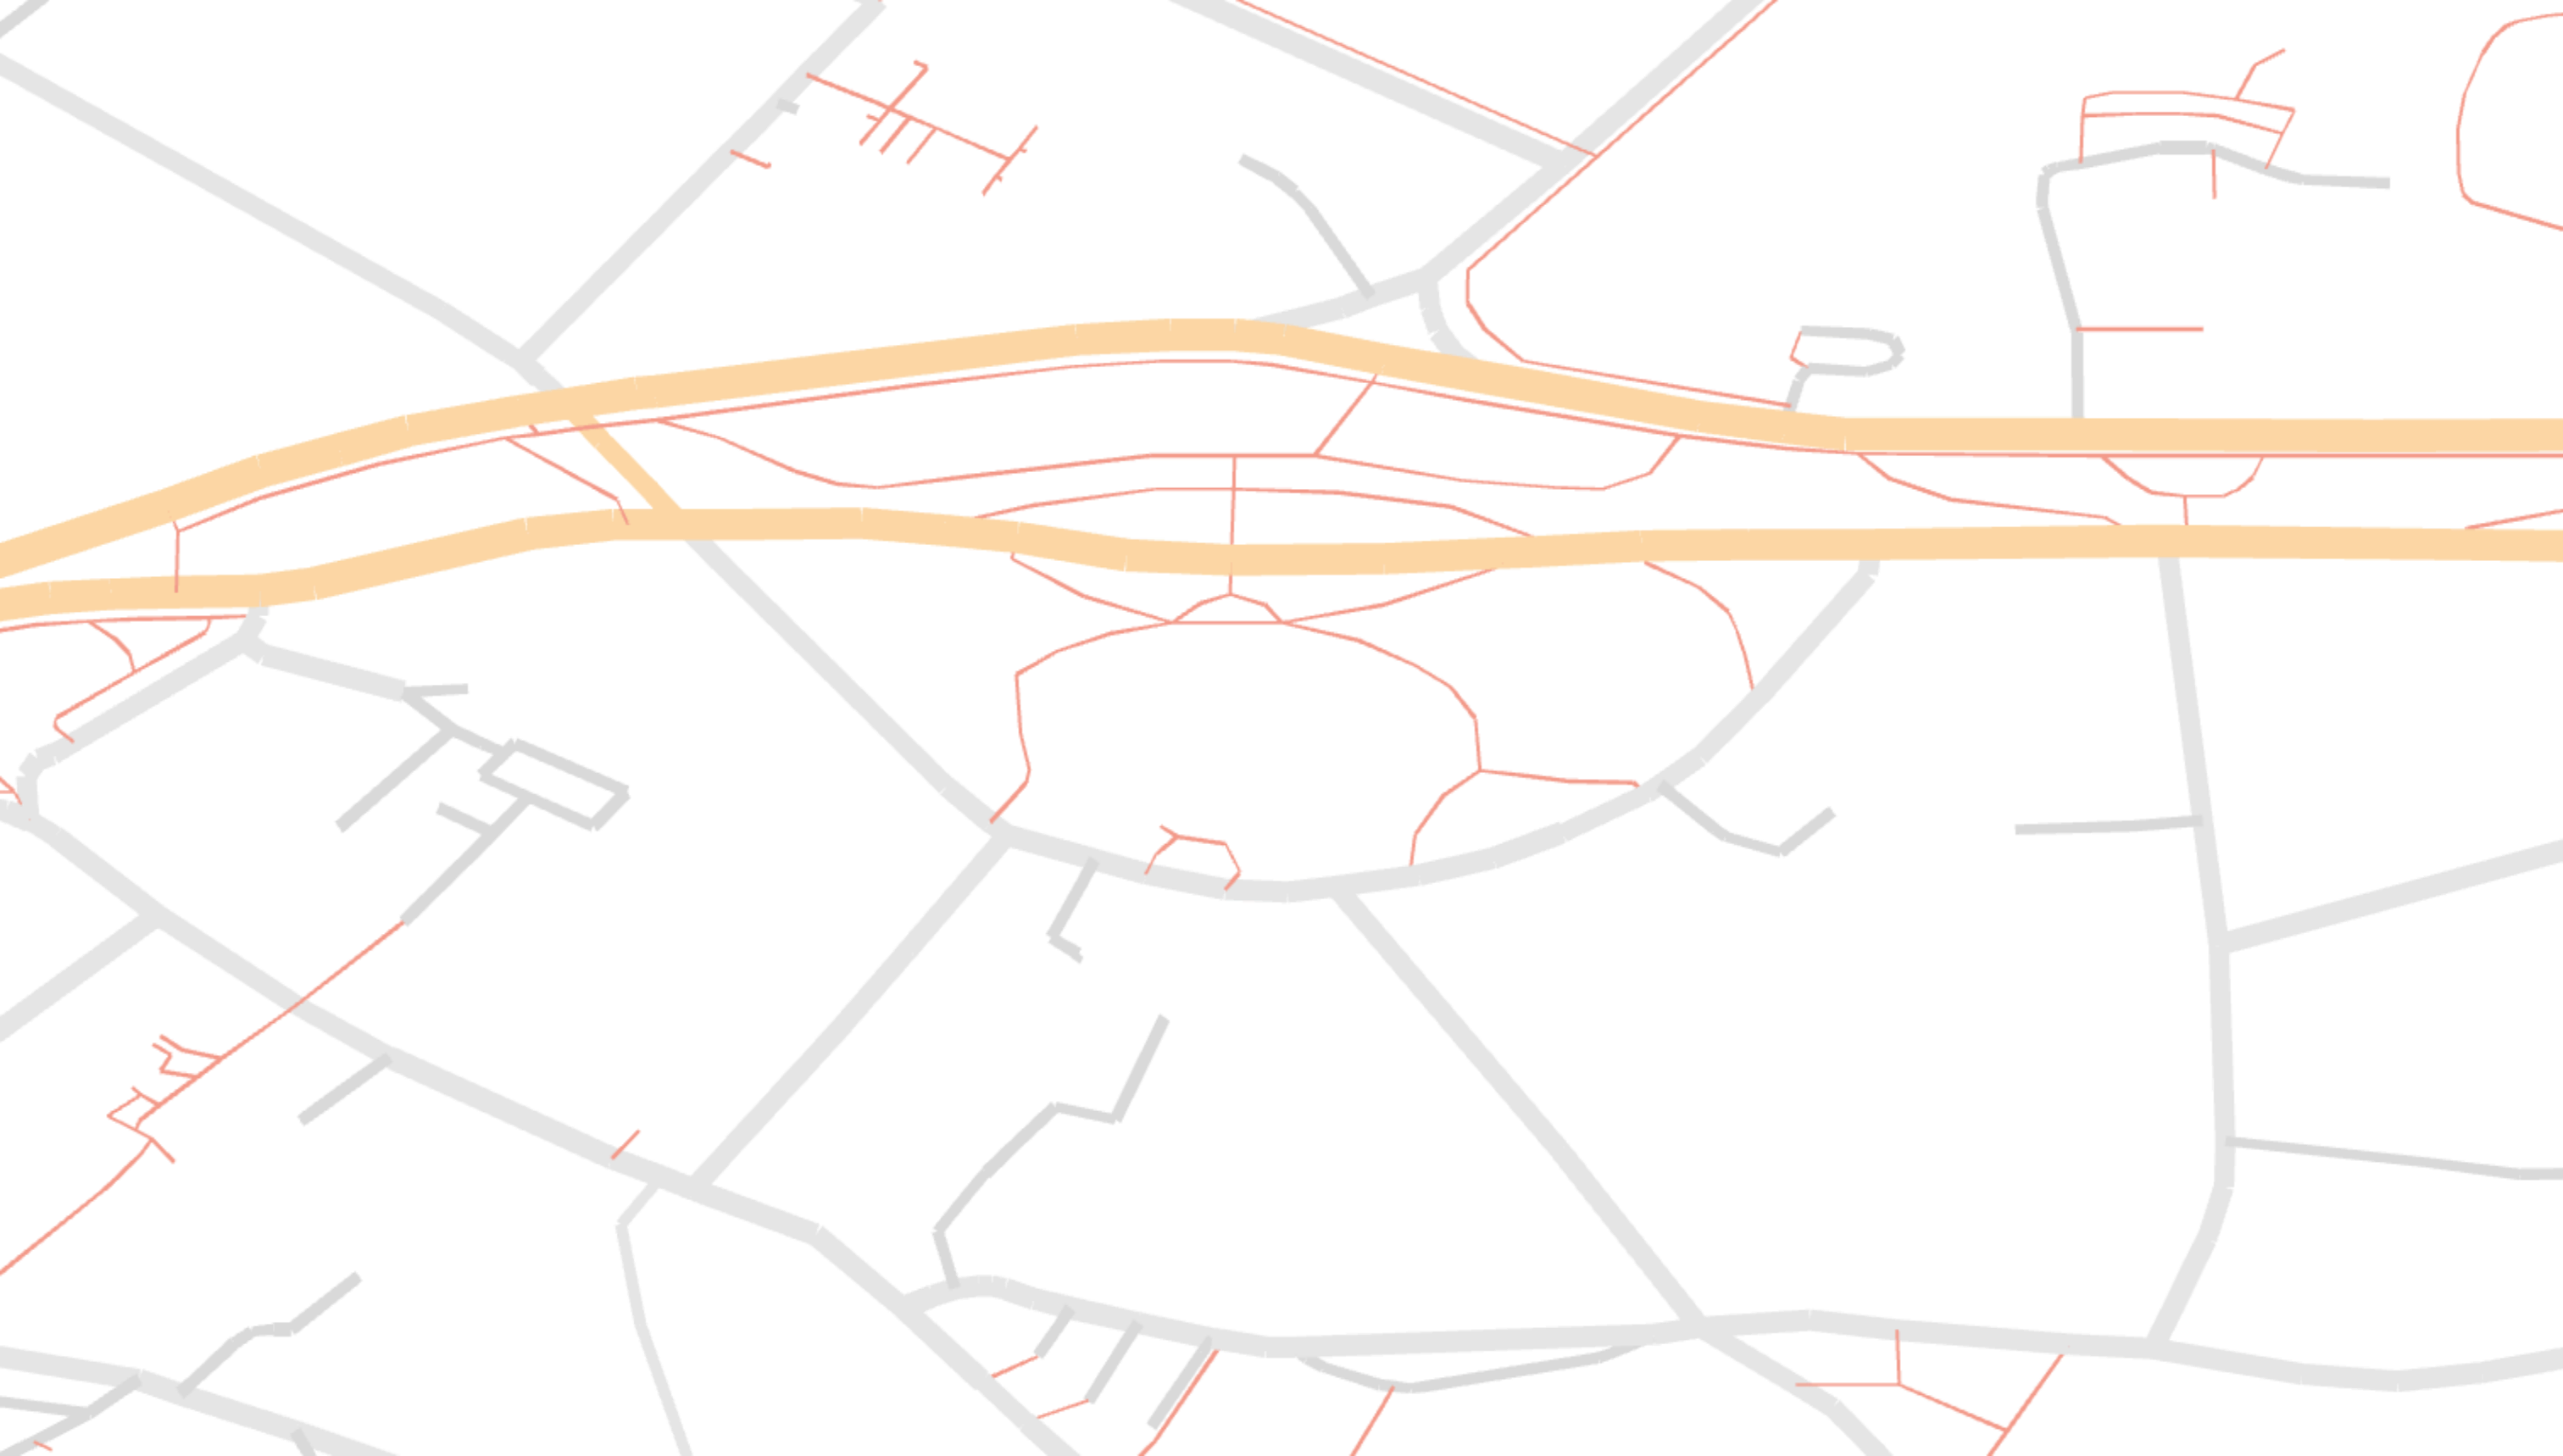
Next post, we will look at using a proper map projection and how all ways can be rendered in a single draw call.
Final notes
- The full working example code is available at GitHub.
- Obviously, there are better and faster ways to render streets. I hope to write blog posts about them in the future.
- If you have comments, corrections or ideas, please message me at [email protected]